The Employee Lifetime Value (ELV) is a helpful scheme for various People Analytics topics, such as compensation and retention projects. It enables a presentation of the business case of HR interventions. This review of ELV is based on my guest lecture at Stanford University’s People Analytics program in June 2022. (Read also my list of speech topics and public speaking engagements)
How do HR practices create business value?
HR practices create business value by connecting HR processes and business results. HR manages various operations throughout the employee lifecycle: workforce planning, recruitment, onboarding, learning and development, feedback and evaluation, recognition and reward, promotion and internal mobility, employee experience, safety and welfare, and retirement. These processes create aggregated workforce capabilities: engagement, culture, efficiency, leadership, innovation, and so forth. Those capabilities enable the organization to achieve its business goals: productivity, quality, and customer satisfaction, resulting in business outcomes, e.g., revenue growth and stakeholders’ return.
People Analytics means that HR uses employee data from HR processes to impact the business. Therefore, our research approach moves from focusing on human resource processes, which we have traditionally measured, to the focus on business performance indicators we want to impact. Indeed, People Analytics initiatives start with a conversation with business leaders. Such a conversation enables you to prioritize projects based on real business questions that affect your company.
How does ELV demonstrate a business case for HR interventions?
The Employee lifetime value is a scheme that connects the people processes to the business outcomes. You probably heard in your career that “people are our most important asset.” It makes sense. People plan and execute the company’s strategy, create competitive advantage, maintain customer relations, and bring innovation to meet future challenges and needs. But how can this statement be quantified? Employee Lifetime Value refers to the expected value the organization gains in the entire time an employee in a particular role spends working.
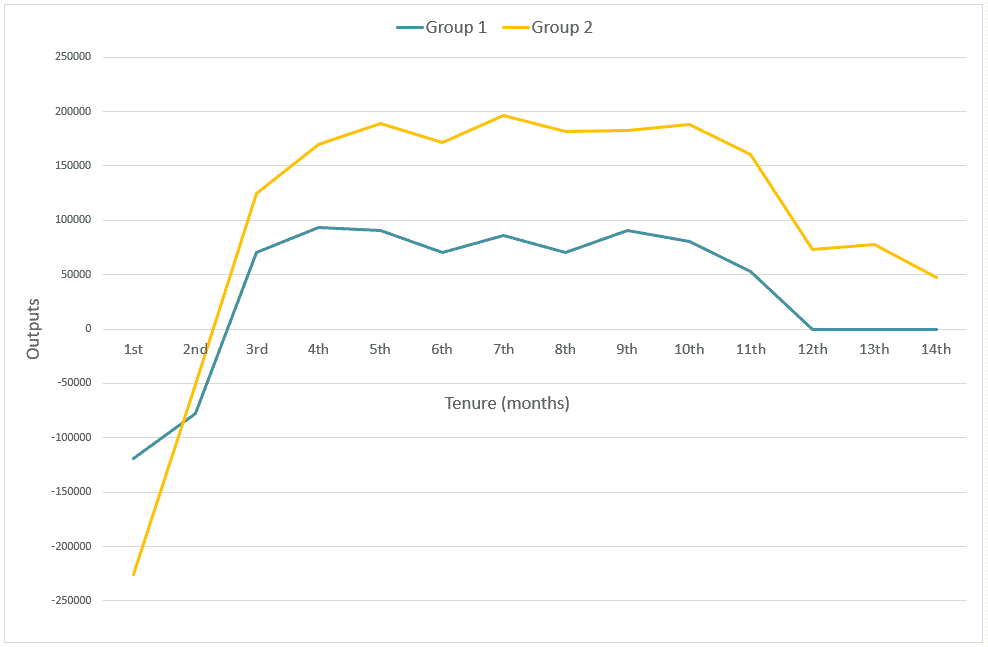
We see in the chart here the employee output throughout the working period in a company. The chart refers to two employee groups, the blue and the orange. The X-axis represents time, and the Y-axis represents the output of a specific role. The output is negative initially because of the costs of recruitment, onboarding, and training, and when the employee is still not productive enough. Then, a positive output rises and stabilizes until the employee gets burned out or decides to leave. The area under this curve represents the entire employee lifetime value, that is, what the employee produces, subtracting the employment cost. To increase these outputs, we want to shorten the time to productivity, reach a higher result, continue improvement for a longer period, and extend the time that the employee remains in the organization. How can we do all this? These are questions that we can explore in an analytical project.
Why is Employee Lifetime Value a helpful scheme?
Employee Lifetime Value is a helpful scheme. First, it enables an understanding of the employee’s journey in the organization regarding investments and returns in each employment stage. Secondly, analyzing employment stages in costs and outputs enables a business case for workforce processes and interventions since workforce costs and investments are related to business results. Lastly, analyzing the Employee Lifetime Value enables a comprehensive understanding of the workforce from a financial perspective that contributes to decision-making related to human capital ROI.
Any professional field has a different employee lifetime value because the outputs are different and measured differently, and the employee lifecycle is unique, including other processes and compensation. But if you choose a critical role and analyze its lifetime value, you can justify changes and improvements in human resources processes.
It is worth noting that Employee Lifetime Value is not a formal financial metric. It is not used for estimating an individual contribution either. But it is a valuable scheme. First, it provides an economic perspective of the workforce processes. It is also communicated well with the management. Finally, analyzing workforce challenges and opportunities in financial terms allows you to evaluate the long-term value of investments in people, just as you would expect any other investment to be considered in the company.
A case study based on Employee Lifetime Value
One of the opportunities I took to leverage the scheme of Employee Lifetime Value was a quick win for an HR group early in its journey to establish People Analytics Practices. Potentially, we can have many alternatives for analysis. So, why the employee lifetime value? A Quick Win can be described on two axes: complexity and impact. We should choose a project which is expected to be most impactful, but such a project that is not too complex. That was the case in this project.
The entire story, People Analytics in SMBs: small data huge impact, was published as an interview. It demonstrates that with the right attitude, HR leaders can successfully overcome barriers such as knowledge gaps, data sources, and shortage of analytics tools. The case study is about the Israeli site of GIA, the world’s foremost diamond authority. GIA is a nonprofit organization and leading source of knowledge, standards, and education in Gemology. The company has set global standards, and every diamond merchant worldwide visits the local branch for the diamond rating before marketing. So, buying a diamond comes with a quality certificate, usually a GIA certificate.
The global company management inquired how GIA Israel develops and retains talent. The answers that the Israeli site had to present could not be based on gut feelings but on numbers to prove that the investment in talent gained the desired results. So, they needed to understand the relations between the people processes and the business results.
While trying to understand employee retention, HR in the Israeli site realized, for the first time, that they should not analyze people’s data on a yearly or quarterly basis but instead use the employee lifecycle for the analysis. Since they recruit in cycles, and employees go through an extended training plan till they become expert diamond graders – a program that may vary in each recruitment cycle – the data should be explored separately for each recruitment cycle over the years. Periodic metrics of retention or attrition make no sense if you mix different cycles which experience other processes in recruitment, onboarding, learning, etc.
Focusing on recruitment cycles enables the team to link improved recruitment processes to decrease attrition numbers. They also found a positive correlation between improved processes and productivity. It was a quick win because, after only a few weeks, they could present these findings to the global management and demonstrate how the people processes in the Israeli site supported the business goals. They used the employee lifetime value of diamond graders to visualize and point to the impact of improved HR processes. In addition, they proved the return on investment in new processes because, for the first time, they described everything in terms of money – budgets and revenues.
The team could also spot the point in time when break-even happened. This point is when total investment in people and total return are equal. After surveying the compensation in the Israeli labor market, regarding competing employers for such workforce segment, they changed the compensation plan by setting different times for financial benefits and even improved benefits to be more competitive, which eventually increased the pay budget in the Israeli site.
Demo with fiction numbers and a hypothetical case
I can’t share the data, but in my workshops and lectures, I continue the story with numbers and visualization, in a demo of a similar analysis, but with fiction numbers and a hypothetical case. Here’s a sneak peek: Imagine a plant with two recruitment cycles: the blue group in the year’s first half and the orange group in the second half. These are the same groups represented in the chart above. We can integrate data from various sources to analyze the employee lifetime value: core HR platform, payment platform, and the business unit.
The fictional company could not succeed in retaining employees in the blue group for more than a year. So, the HR team decided to change some processes to deal with this challenge. The changes made are represented by their costs. First, they improved the recruitment process with better and more expensive assessment tools. The idea was that better and more suitable candidates would eventually contribute to workforce stability. Then, onboarding and training activities provided within one month to the blue group were split for the orange employees. The idea was that more extended support would be better for onboarding success till reaching the point of fully contributing. So, the training budget remained the same but was used for a more extended period. Finally, the performance review was the same in the two groups after six months.
The employee value in each month is the sum of outputs subtracting the costs: base salary, bonus, and HR processes costs. Suppose we organize the groups’ numbers on the same time axis, tenure in months. In that case, we can explore how the employee lifetime value changed after the changes in people processes.
Although the company invested more in recruitment in the orange cycle, the break-even point remained the same after three months because the orange employees gained better outputs. Moreover, the orange employees remained at work for a more extended period. As a result, the area under the orange curve is larger than the area under the blue curve. The change in HR processes contributed to the business results.